AnalyticsHow the business is doing, counted one way.
Analytics is the board you open to ask how the business is really doing — and to get the same answer twice.
What it does
Seven boards, one arithmetic
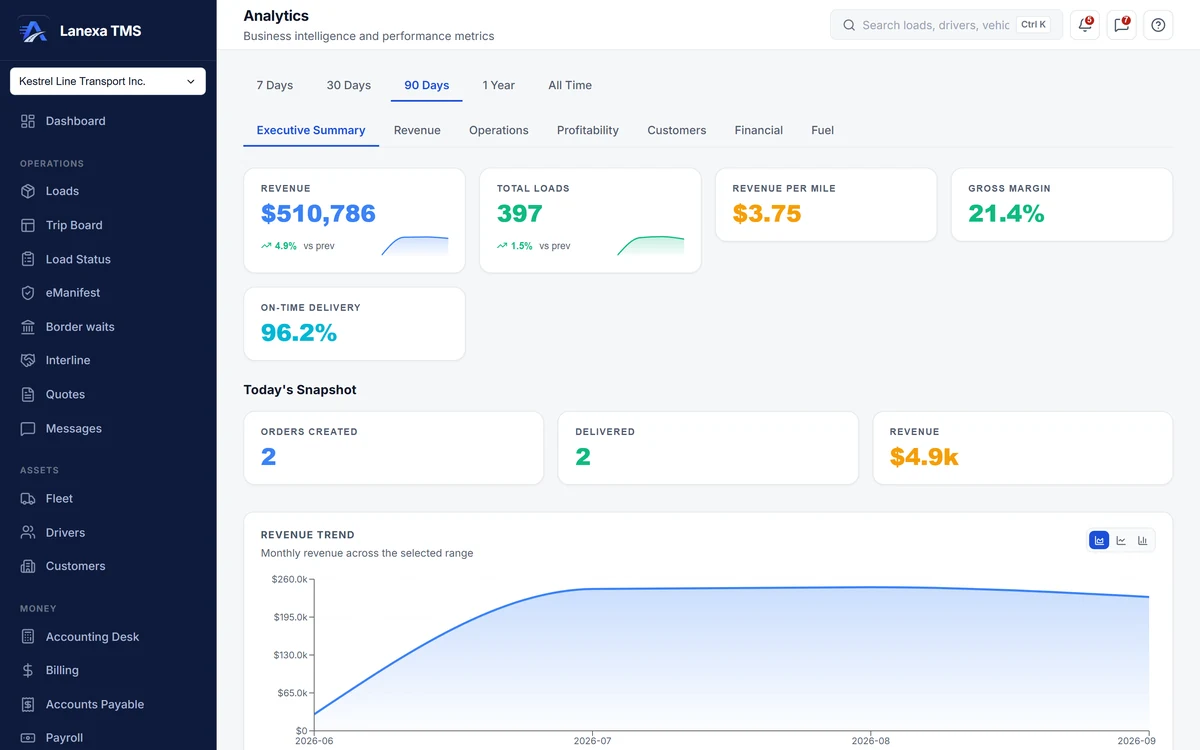
Executive Summary, Revenue, Operations, Profitability, Customers, Financial and Fuel, over the last 7 days, 30 days, 90 days, a year or all time. Receivables and overdue are never narrowed by the window, so the oldest debt cannot be filtered out of the view built to surface it.
Every number shows its coverage
A headline figure arrives with how many of your records it covers — for example, how many loads carry a captured cost. Where the data is thin you see a dash and what is missing, never a zero that looks like an answer.
Margin you can believe
Margin is computed only over loads that carry a cost — carrier bills and driver pay included — with each cost converted at its own document's booked exchange rate. Loads without a cost are excluded and counted, not scored at 100% margin.
The losing loads first
The Profitability board lists the 50 worst-margin loads first, beside lane profitability with rate per mile, margin and how many of each lane's loads carry a cost — because a profitability screen exists to find the loads that lose money.
Receivables, one definition
Open receivables, genuinely overdue money and real DSO — the average days from issue to payment — use the same definitions as Billing and the Dashboard, with AR aged into current, 1–30, 31–60, 61–90 and 90+ days and the most urgent invoices listed.
Fuel measured against your own fleet
Fuel spend, average price and cost per truck; receipts paid more than 15% over your own fleet's average in the same jurisdiction; and your IFTA position by jurisdiction — share of miles against share of fuel bought, with the tax per gallon.
The detail, when you want it
Everything live in Analytics12
- Revenue, loads, revenue per mile, margin % and on-time delivery on one summary
- Change against the previous equal period, with sparklines
- The quote funnel from created to converted, with win rate over resolved quotes
- Top 10 customers, lanes and equipment types by revenue
- Loads by status and by month, fleet status and driver rankings
- Invoiced and booked-but-not-billed figures for your top 25 customers
- Customer retention by month
- Any chart switched between bar, line, area, pie, donut and horizontal bar — remembered per chart
- The board and window kept in the link, so a shared URL opens the same view
- Money boards withheld in words for roles without money visibility — withheld, not zero
- A sales role still gets a customer ranking by volume, with the money columns removed
- Revenue, profitability and outstanding-invoice CSV exports, blank where a value is unknown
Which plan includes itAnalytics is on Start, Fleet and Enterprise; it is not part of Solo.
Inside the board, what each person sees follows their role: the money boards need money visibility, and the CSV exports need export permission. Compare plans
How we count105 live capabilities of 112 catalogued.
Each capability is one control, field, tile, column or disclosed number, counted one by one. The registry
Why do some numbers show a dash instead of a zero?
A dash means the data is not there yet — for example, loads with no captured cost — and the tile says what is missing.
Lanexa shows how many records each figure covers instead of turning a gap into a zero that looks like a real result.
Can a dispatcher see revenue and margin in Analytics?
Only if their role includes money visibility, which the dispatcher role does not by default.
Without it, the Revenue, Profitability, Financial and Fuel boards show a plain refusal, money tiles read Restricted, and the Customers board falls back to a ranking by load volume. Exporting money needs a separate export permission.